Introduction
APIs are the backbone of modern applications, but when they fail, debugging them can be frustrating. Whether you’re working with a third-party API or troubleshooting your own backend, you need quick ways to test and diagnose issues.
In this guide, we’ll explore the fastest ways to debug APIs using cURL, Postman, and Browser DevTools—all in under 30 seconds! 🚀
🔥 1. Debug APIs with cURL (Command Line Tool)
cURL is a powerful command-line tool that allows you to send API requests directly from the terminal. It’s perfect for quick testing without needing a browser or external tools.
👉 Test a Simple GET Request
Run this command to fetch data from an API:

✅ Output: JSON response printed in the terminal.
🔹 Why use this? This is the fastest way to check if an API is responding.
👉 Send a POST Request with JSON Data
To send JSON data in a request, use:

✅ Output: The API returns a success or failure response.
🔹 Why use this? Quickly test authentication or data submission.
👉 Debug with Verbose Mode
If an API call fails, use the -v flag for detailed logs:

✅ Output: Detailed headers, request, and response logs in the terminal.
🔹 Why use this? Helps identify request errors, headers, and authentication issues.

🔥 2. Debug APIs with Postman (GUI Tool for API Testing)
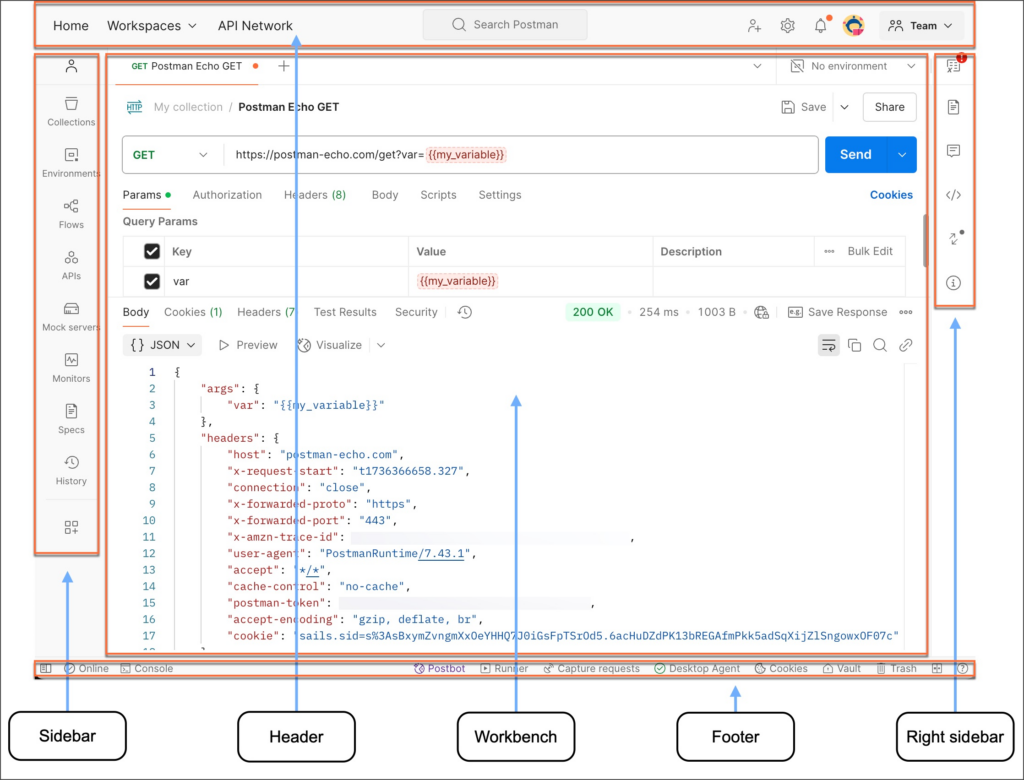
Postman is a visual API debugging tool that allows you to send requests, inspect responses, and debug issues easily.
👉 Send a Quick API Request
- Open Postman
- Enter the API URL
- Select GET, POST, PUT, DELETE
- Click Send and inspect the response
✅ Output: The API’s JSON response appears in the response window.
🔹 Why use this? User-friendly way to send API requests without writing commands.
👉 Set Authentication Headers
Many APIs require authentication tokens. In Postman:
- Go to Headers
- Add
"Authorization"as a key - Set value as
"Bearer YOUR_TOKEN"
✅ Output: Successfully authenticated API call.
🔹 Why use this? Essential for debugging secure API endpoints.
👉 Automate API Testing with Collections
Postman Collections allow you to save and run multiple API requests at once.
- Create a Collection
- Add multiple API requests
- Click Run Collection to test all at once
✅ Output: Automated testing of multiple API endpoints.
🔹 Why use this? Helps test API workflows with different input scenarios.

🔥 3. Debug APIs with Browser DevTools
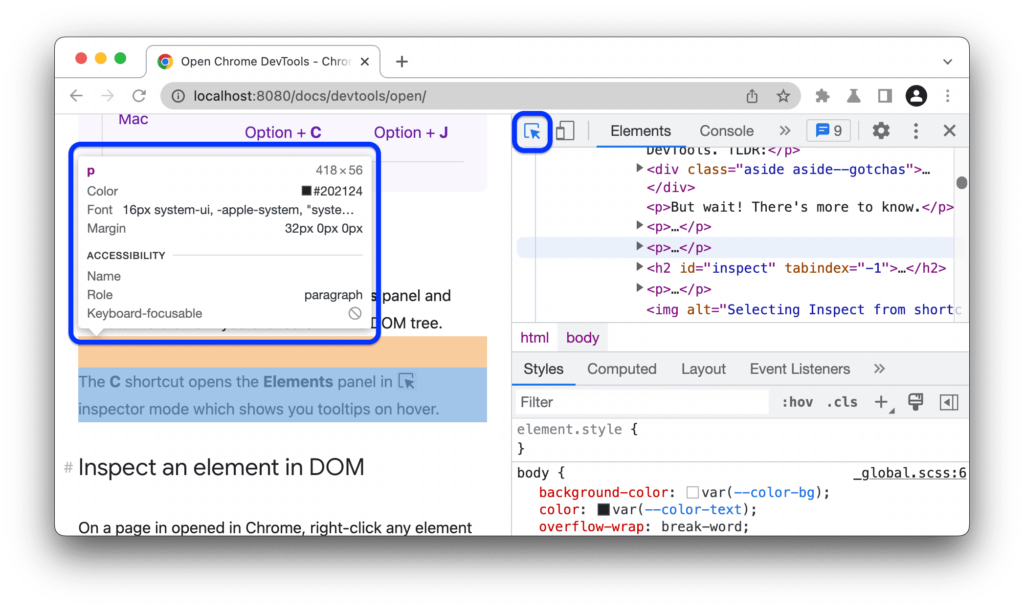
Most modern browsers allow you to inspect API calls directly in Developer Tools.
👉 Open the Network Tab in Chrome/Firefox
- Right-click on the webpage and select Inspect
- Click on the Network tab
- Filter by XHR or Fetch/XHR
✅ Output: A list of API requests made by the webpage.
🔹 Why use this? Great for debugging API calls made by frontend applications.
👉 Inspect API Responses
- Click on any request in the Network tab
- View Headers, Response, and Status Codes
✅ Output: Shows request details, error messages, and response payloads.
🔹 Why use this? Helps diagnose API failures directly in the browser.
👉 Replay an API Request Without Reloading the Page
- Right-click on a failed API request
- Select Replay XHR
- Modify parameters and send again
✅ Output: Quick retesting of API requests without refreshing the whole page.
🔹 Why use this? Saves time while debugging frontend API interactions.

🔥 Bonus: Use Online API Debugging Tools
If you don’t want to install anything, try online API testing tools like:
✅ Hoppscotch – Lightweight API testing in the browser.
✅ ReqBin – Run API calls online.

These tools work like Postman but run entirely in your browser.
Conclusion
Debugging APIs doesn’t have to be slow or frustrating. Using cURL, Postman, and Browser DevTools, you can quickly send API requests, inspect responses, and troubleshoot issues in under 30 seconds!
🚀 Which method do you use for debugging APIs? Let me know in the comments!
